Cohorts Machine
Tackling the “did it improve?” question
When developing a product, we are often faced with questions like:
- Does the newer version of the product drive more engagement compared to previous version?
- Do users using the new feature end up having better retention than the ones not using the new feature?
- What feature should we invest resources on? Do users interacting with featureA retain longer than the users interacting with featureB ?
- Etc…
Having a mechanism ready to use to tackle these questions will speed up analysis, as opposed to approaching it in an ad-hoc way every time. Also, the maturity of a curated mechanism gives confidence and consistency in the results. Enter the Cohorts Machine.
Cohorts Machine
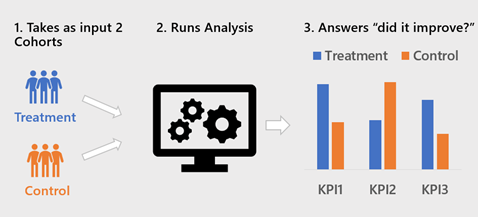
A machine that takes as input a Treatment Cohort, a Control Cohort and outputs whether there’s a significance change in a KPI.

Cohorts Machine
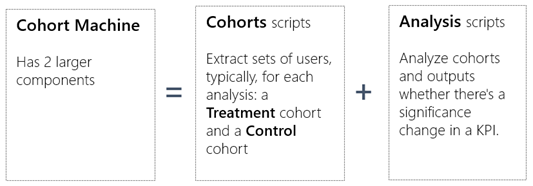
Technical breakdown

Cohorts scripts
These scripts function is to build a list of User id’s. Most commonly, it generates 2 sets of users, the Treatment **cohort and the **Control cohort, with following requirement
Req1. The user id column needs to be named in a consistent way.
Analysis scripts
Build a separate script for each Analysis view, i.e. a script for engagement, another for retention, user life cycle funnel, etc… with following requirements:
Req.1 An Analysis script is independent of logic behind cohort.
So that each Analysis script can be applied to any cohort.
Req.2 An Analysis script follows a consistent input and output structure.
This helps with interpretation, automation and with the adding/removing of new scripts.
Input parameters
- Analysis name
- Treatment users
- Treatment date start (of comparison)
- Treatment date end (of comparison)
- Control users
- Control date start (of comparison)
- Control date end (of comparison)
- [Optional] Flag: “Exclude Outliers?”
- [Optional] Flag: “Exclude All Up 3rd automatic cohort?”
2 separate Outputs
- Results — table with results using consistently named columns across analysis scripts (when possible)
- Report — dates, counts before and after outlier’s removal, naming of cohorts, significance testing information, etc.
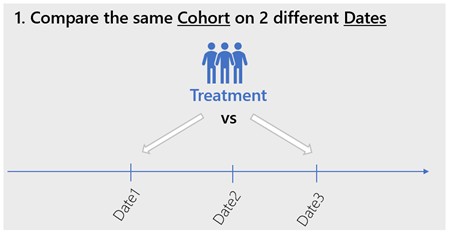
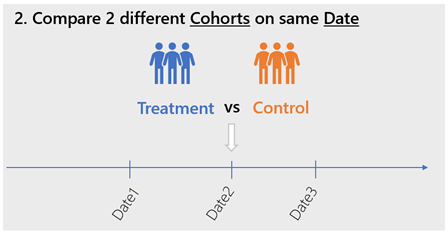
Req.3 Support Analysis of cohorts, on both approaches:
- Same Cohort on 2 different dates (FYI: could be influenced by seasonality, but sometimes not possible to get a control group)
- 2 different Cohorts in the same date
(That’s why the Analysis script input has a separate date for treatment and another for control)


Req.4 Allow to run analysis for a range of date (when makes sense). To enable cohorts analysis trending over time.
Req.5 Automatically include a 3rd cohort, the “All Up”.
The “All Up” cohort allows to compare the cohorts against a baseline. Not always needed but could be useful when for example there’s no 2nd group to compare to. Can be turned off with an input flag. Can be sampled if needed to accelerate processing time.
Req.6 Consistent Analysis script structure, so that developing and editing is easier maintenance, like so:
Analysis Script structure
- Input (& Options)
- Join Cohorts w/ circuits dat (including treatment, control, AllUp)
- Outlier detection (for Control and Treatment)
- Calculate KPI’s (average, median, etc…)
- Significance Testing (Control vs Treatment)
- Report
Req.7 Exclude Outliers.
The outliers are the users who’s KPI is ≥ 3 standard deviation away from the mean. Have a flag as input to allow turn it on and off.
Req.8 Include statistical testing.
Include in the report Output whether the difference observed (on the last date, if there are multiple) between Treatment and Control is statistical significant. See here the »Tests to Use«
Community Effort
Any member of team can contribute with an Analysis or Cohort script, that then becomes available for rest of team to leverage. For example, update an existing ad-hoc analysis with the structure detailed above and then add into the repository of the Cohorts machine scripts.
