
Statistical Significance
WHY
A numeric result has statistical significance when it is very unlikely to have occurred by natural variation (aka chance)
WHEN
In general, required on every numeric result, e.g.:
- Comparison of 2 cohorts
- A measure change (is it natural variation or real shift in a metric?)
- Summarization of data: average, median
HOW
UseCase1
CohortA average is higher than CohortB average, but is it statistically significant ?
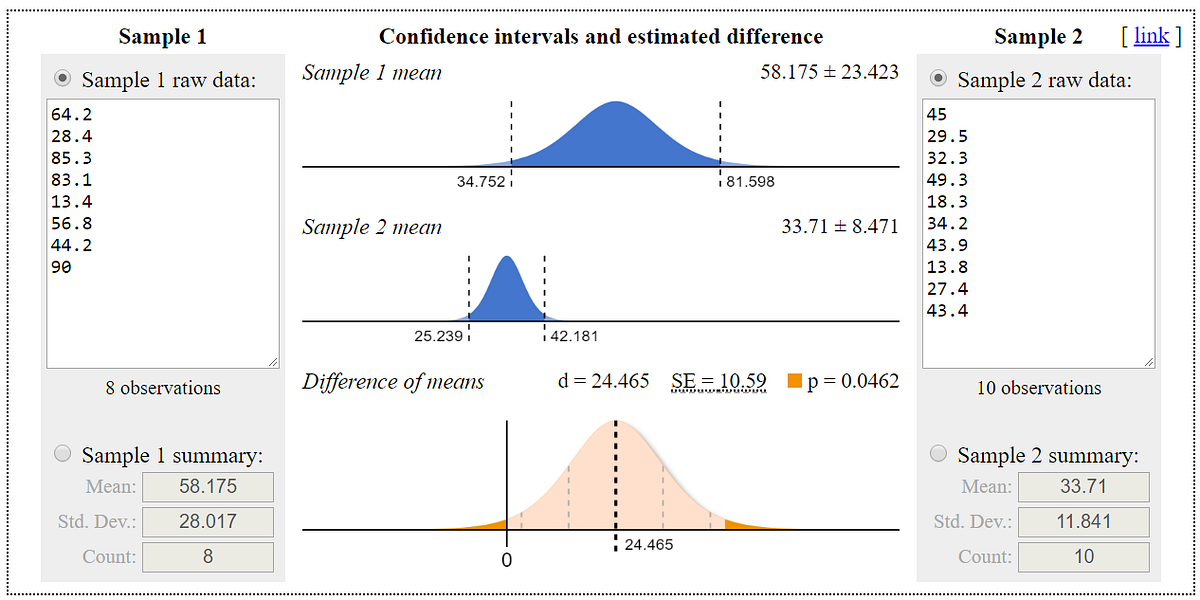
Tool: https://www.evanmiller.org/ab-testing/t-test.html Note that it also supports entering summary values (mean, std, usersCount) instead list of raw values.
UseCase2
Does the rate of success differ across two groups? (aka Proportion testing, very commonly used in A/B testing)
Tool: https://www.evanmiller.org/ab-testing/chi-squared.html
UseCase3
A metric trend has changed, is it just a natural (expected) variation? Or is in fact such an unlikely value (given its history) that it’s a real shift?
Tool: Is trend change significant? Time Series Analysis: CausalImpact (R tool), use a nonbiased trend as inputs, and get a validation whether change in trend is significant.
UseCase4
CohortA median is higher than CohortB median, but is it stat. significant ?
Tool: Moods http://www.real-statistics.com/non-parametric-tests/moods-median-test-two-samples/ or Wilcoxon http://www.real-statistics.com/non-parametric-tests/wilcoxon-rank-sum-test/ (or Mann-Whitney for >2 groups http://www.real-statistics.com/non-parametric-tests/mann-whitney-test/)
UseCase5
How many users are needed to be confident that a change is significant? Very commonly needed for A/B tests, but useful for getting a feeling for cohorts minimum size.
Tool: https://www.evanmiller.org/ab-testing/sample-size.html
UseCase6
Average is x, but variation within the original list of values is big, so how confidence we are on it ?
Tool: Result is average x, but with expected variation of: [x-1.96*std, x+1.96*std]
WHAT CAUSED IT ?
Isolate potential cases as hypothesis and test them.
A/B testing method: isolate/randomize every other factor, like seasonality, time of day, type of user, etc.. except the hypothesis being tested, like a user UX change, so that when a significant change has happened we know is surely caused by UX change.