
Dashboards Toolkit
An important part of being data driven is to have a daily feedback on data, here’s a couple of automated dashboards i’ve built recently:
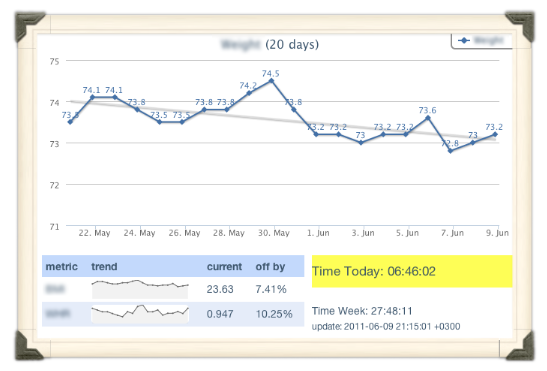
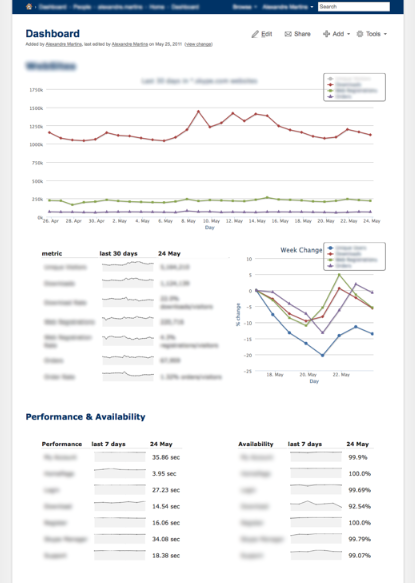
In these most of the data is displayed as is, next iteration could enrich the data further with:
- Adding the data of a year/6months ago for direct comparison could be interesting.
- Fits to data, like a regression line that shows the overall tendency, plus allows to make predictions on next day/week/month values.
- More of relative change plots, like the protovis index-chart are very useful.
- Confidence intervals pointing out that the changes are unlikely to be by chance.
- etc…
Tools & Code
Coded in ruby, it aggregates data from different sources, and based on an html template it generates html with the full dashboard. Its fully automated, and i make it run on daily basis using a cron job.
Uses highcharts as the javascript charting engine, which i can only say good things about, very nice looking and allows user interaction.
I placed on github the code i use as the base to build the dashboards, find it here: https://github.com/al3xandr3/Dashboard
A few bits:
Getting RescueTime Data
require 'open-uri'
require 'date'

key = "yourownkey"

res = {}
open("https://www.rescuetime.com/anapi/data?key=#{key}&perspective=interval&format=csv&resolution_time=day&restrict_kind=activity") do |f|
  i=0
  f.each do |l|
    unless i==0
      t, sec, some, app, cat, prod = l.split(",")
      res[:week] += sec.to_i
      res[:day] += sec.to_i if Date.parse(t).day == Date.today.day
    end
    i+= 1
  end
end

print res
Getting Google Spreadsheets Data
require 'gdata/client'
require 'gdata/http'
require 'gdata/auth'
require 'open-uri'
require 'date'

client = GData::Client::Spreadsheets.new
client.clientlogin('yourmail@gmail.com', "yourpass")
key = "yourspreadsheetkey"
test = client.get("http://spreadsheets.google.com/feeds/download/spreadsheets/Export?key=#{key}&fmcmd&exportFormat=csv")
values = []
i=0
test.body.each_line do |l|
  t,w,co,wa,h = l.gsub("\n","").split(',')
  unless i==0
    values << [Date.parse(t), w.to_f, wa.to_f, h.to_f]
  end
  i+=1
end

print values
Getting imap mail attachments
require 'net/imap'
require 'date'

opts[:inbox]   ||= "Inbox"
opts[:search]  ||= ["SINCE", "8-Aug-2007"]
opts[:attach]  ||= ["CSV"]
opts[:savedir] ||= "."

imap = Net::IMAP.new('mail.server.com', :port => 993, :ssl => true)
imap.login('yourmail@server.com', 'yourpassw')
imap.select(opts[:inbox])
imap.search(opts[:search]).each do |uid|
  msg = imap.fetch(uid, ["ENVELOPE","UID","BODY"])[0]
  body = msg.attr["BODY"]
  date = Date.parse(msg.attr["ENVELOPE"].date)
  i = 1
  while body.parts[i] != nil
    type = body.parts[i].subtype
    encoding = body.parts[i].encoding
    name = body.parts[i].param["NAME"] || date.to_s
    i+=1
    attachment = imap.fetch(uid, "BODY[#{i}]")[0].attr["BODY[#{i}]"]
    p "#{name}, #{type}, #{encoding}"
    if opts[:attach].include? type and not attachment.nil?
      File.open(opts[:savedir] + name,'wb+') do |f|
        if encoding == "BASE64"
          f.write(attachment.unpack('m')[0])
        else
          f.write(attachment)
        end
      end
    end
  end
end
Posting html to a confluence wiki
require 'xmlrpc/client'

user = "username"
pass = "password"
area = "area"
page_name="page"
content = "<h1>Big Header</h1>"
confluence = XMLRPC::Client
      .new2("https://#{user}:#{pass}@confluence.server.com/rpc/xmlrpc")
      .proxy("confluence1")
page = confluence.getPage("", area, page_name)
page["content"] = "{html}#{content}{html}"
confluence.storePage("", page)
Creating a highcharts JS chart
require 'erb'
require 'date'

def line arg={}

  arg[:height] = arg[:height] || ""
  arg[:width] = arg[:width] || ""

  line_chart = %{
    <div id="<%= arg[:name] %>" style="height:<%= arg[:height] %>px;width:<%= arg[:width] %>px;"></div>
    <script type="text/javascript">
     var month = new Array("Jan","Feb","Mar","Apr","May","Jun",
                           "Jul","Aug","Sept","Oct","Nov","Dec");
     var chart;
     $(document).ready(function() {
     chart = new Highcharts.Chart({
        chart: {
           renderTo: '<%= arg[:name] %>',
           defaultSeriesType: 'line',
           marginRight: 40,
           marginBottom: 40
        },
        credits:{
          enabled:false
        },
        plotOptions: {
           line: {
              dataLabels: {
                 enabled: <%= arg[:data_labels] || false %>
              }
           }
        },
        title: {
           text: '<%= arg[:name] %>',
           x: -20 //center
        },
        subtitle: {
           text: '<%= arg[:subtitle] %>',
           x: -20
        },
        xAxis: {
           type: "datetime",
           title: {
              text: '<%= arg[:xlabel] %>'
           },
        },
        yAxis: {
           min: <%= arg[:ymin] || 0 %>,
           title: {
              text: '<%= arg[:ylabel] %>'
           },
        },
        tooltip: {
           formatter: function() {
             return (new Date(this.x)).getDate() + ' ' +
                    month[(new Date(this.x)).getMonth()] +
                     ': '+ this.y;
           }
        },
        legend: {
           layout: 'vertical',
           align: 'right',
           verticalAlign: 'top',
           x: 0,
           y: 0,
           borderWidth: 2
        },
        series: [{
           pointInterval: 24 * 3600 * 1000,
           pointStart: <%= arg[:start_time] %>,
           name: '<%= arg[:name] %>',
           data: <%= arg[:values] %>
        }]
       });
      });
    </script>
    }
  ERB.new(line_chart).result(binding)
end

c = line(:name => "My Fancy Chart",
     :subtitle => "subtitle",
     :xlabel => "y label",
     :ylabel => "y label",
     :start_time => (Date.today-7).to_time.to_i * 1000,
     :values => [12.2, 13.3, 11.1, 15.5])
print c