
T is for Table
T extends Pandas Dataframes with a collection of table manipulation methods as well as statistical, machine learning, financial and EDA methods.
For example it integrates Bootstrap ReSampling statistical methods (a.k.a Hacker Statistics)
Basic Usage
Create a plain data frame
>>> df = pd.DataFrame( {
    'user':['k','j','k','t','k','j']
    ,'period':['pre', 'pre', 'pre', 'pre', 'post','post']
    , 'kpi':[13,12,2,12,43,34]
    })
| user | period | kpi | |
|---|---|---|---|
| 0 | k | pre | 13 |
| 1 | j | pre | 12 |
| 2 | k | pre | 2 |
| 3 | t | pre | 12 |
| 4 | k | post | 43 |
| 5 | j | post | 34 |
Filter the rows that have the value “post” and from that select the columns “user” and “kpi”
>>> t.select( t.where(df, "period", "post"), "user", "kpi")
Note that alternativelly we can also use the Pandas pipe operator to chain functions, with the same result I’ve renamed “pipe” to “p” when the T library is included:
(df
  .p(t.where, "period", "post")
  .p(t.select, "user", "kpi"))
| . | user | kpi |
|---|---|---|
| 0 | k | 43 |
| 1 | j | 34 |
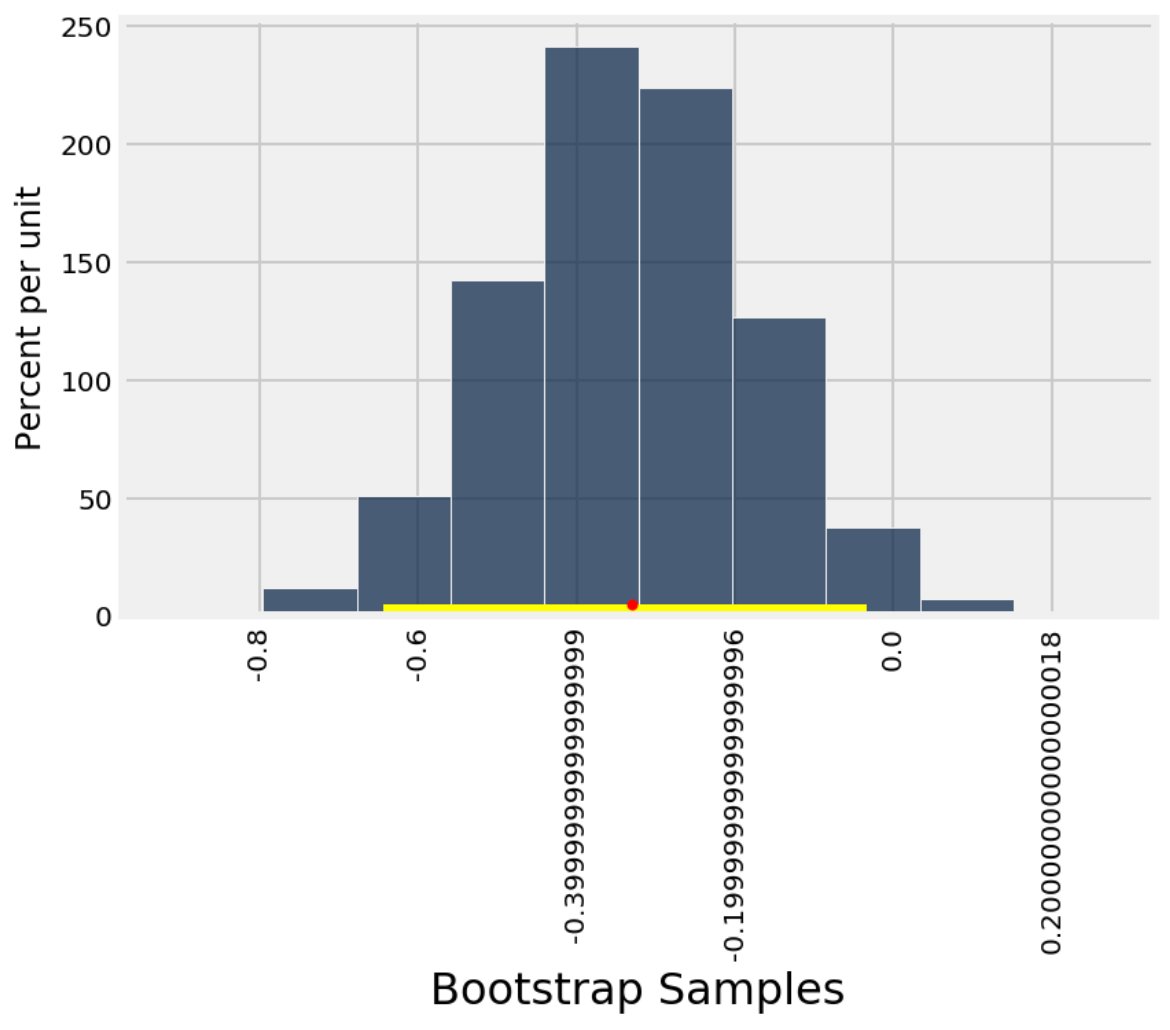
Calculate the mean’s confidence interval. It includes plotting it.
>>> t.ci_mean(pd.DataFrame (np.random.normal(size=(37,2)), columns=['A', 'B']), 'A')
{'mean': -0.33, '95% conf int of mean': array([-0.64, -0.03])}
More Examples
https://github.com/al3xandr3/Data-Science-ipynb/blob/master/t%20is%20for%20table%20version2.ipynb
Run Tests
> cd "C:\path\my\projects\t"
> pytest